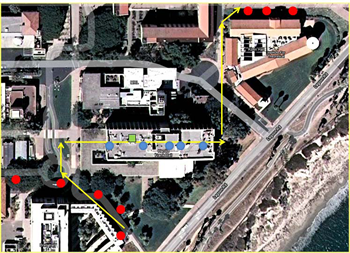
Figure 1: Aerial view of the UCSB indoor
and outdoor camera network.
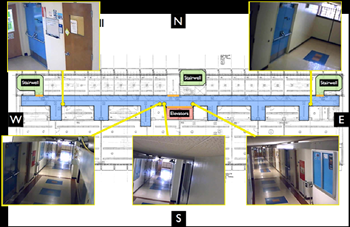
Figure 2: Locations and directions of
the indoor cameras.
Camera Surveilance
We have completed the setup of the surveillance camera network in the UCSB campus.
Figure 1 is the satellite view of Harold Frank Hall (Engr I) in UCSB. Currently there are 40 fixed
outdoor cameras deployed along the bike paths on the campus. Several of them are located very close
to HFH as shown in circles in Fig 1. Outdoor cameras communicate to the data server through wireless
connection. The green square on top of the building indicates the location for one of the wireless
control sites/antennas. Each control site can communicate with all the cameras within a radius of
approximately 100 meters. Harold Frank Hall is a 5 story building, and there are a total of 27 cameras
deployed in it — 7 cameras on the first floor, 5 cameras on each of the other floors. All the entrances
as well as the elevators are being monitored. Figure 2 is a snapshot of the camera position on the 3rd floor.
They can easily be adjusted to cover different views, e.g. hallway, rooms. Both communication and power supply
are though hard wire. Thus, all the indoor cameras can operate 24 hours a day, while the outdoor cameras run on
portable batteries. This means they can only run during specific intervals.
In addition to the physical setup of the camera network, we have also made progress on algorithms which are
to be used in analysis of the observations in the camera network. One of the key components is detection and
localization of the subjects in the videos. We have demonstrated that improved classification accuracy can be
achieved by fusing multiple visual cues together (Dikmen and Huang, 2010). Equally important is to make the
association between images of people. The same person can enter the views of several cameras throughout the
day and it is important to know who is who especially through long periods of observations. Our latest developed
system solves this correspondence problem through learning a distance metric (Dikmen et al., 2010).
Information Network Visualization (PARC and UCSB)
We designed "SmallWorlds", a visual interactive graph-based interface that allows users to specify, refine and
build item-preference profiles in information/social networks. The interface facilitates expressions of taste
through simple graph interactions and these preferences are used to compute personalized, fully transparent item
recommendations for a target user. Predictions are based on a collaborative analysis of preference data from a
user's direct peer group on a network. We find that in addition to receiving transparent and accurate item
recommendations, users also learn a wealth of information about the preferences of their peers through interaction
with our visualization. Such information is not easily discoverable in traditional text based interfaces. This work
(Gretarsson et al. 2010) will appear in Computer Graphics Forum Journal, 2010.
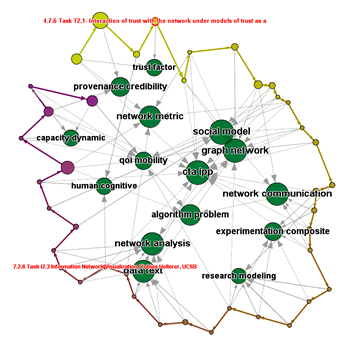
Figure 3: TopicNets visualization of entire
CTA Initial Program Plan (IPP). First section starts in yellow at top
left, last section ends in purple at nearly full circle. Two Sections
(== subtasks) have been selected (red labels).
Scalable, Human-Centric Information Network Systems
The identification of clusters, well-connected components in a network is useful in many
applications from biological function prediction to social community detection. However, finding these clusters
can be difficult as graph sizes increase. Most of the existing graph clustering algorithms scale poorly in terms
of time or memory. An important insight is that many clustering applications need only the subset of most strongly
connected clusters, and not all clusters in the entire graph. Marcopol and Singh proposed a new model, Top Graph
Clusters (TopGC), which probabilistically searches large, edge-weighted, directed graphs for their most strongly
connected clusters in linear time. The algorithm is inherently parallelizable, and is able to find variable size,
overlapping clusters. When compared with three other state-of-the art clustering techniques, TopGC achieves running
time speedups of up to 70% on large scale real world datasets. In addition, the clusters returned by TopGC are
consistently found to be better both in calculated score and when compared on real world benchmarks. (Macropol and
Singh 2010)
We have had great success furthering people's understanding of large heterogeneous
information networks through development of an interactive tool for analyzing
topic-based relations among large text collections. Through an external
collaboration with Topic Modeling experts at UC Irvine, we have adapted
our graph visualization framework, WiGis, to support visualization of output
from an LDA algorithm, by mapping LDA output (Topics, Documents and probabilistic
association data) onto various dimensions of an interactive graph. For example,
color, node types and similarity based topic clustering. During this period,
we have applied our novel approach to exploration of a diverse set of heterogeneous
data sources, including a large corpus of awarded NSF grants, a collection
of about ten thousand research papers from the California Institute for
Telecommunications and Information Technology (CalIT2), the 2009 US Health
bill, as well as the initial program plan of this Collaborative Technology
Alliance (cf. Figure 3). During this period, we have also researched new
ways to use interactive graph manipulation (e.g. selection, filtering, and
expansion of result sets; grouping nodes and highlighting relationships
by interactive dragging) as a control mechanism for complex data mining
algorithms. (Gretarsson et al. 2010)
Knowledge Discovery in Information Networks
Text analysis in composite information and collaborative networks
where multiple expert groups work together to process IT trouble tickets:
A unified generative topic/network model, Optimized Network Model (ONM),
has been developed to characterize such process. It includes a text/network
classification module to combine heterogeneous text and network information
together for better expert classification and recommendation. It has potential
military applications, when trouble problems are transferred among different
intelligence agents for resolution. This work is for INARC I3.1 and I3.3.
The work has been accept by KDD'2010 (Miao, et al., 2010)