Previous
|
Students
Julie Dillemuth, Geography
Alex Villacorta, Statistics
Rama Hoetzlein, Media Arts & Tech
Carlos Castellanos, Media Arts & Tech
Shane Kendrick, Undergraduate Researcher
|
Faculty
Advisors
Keith Clarke, Geography
S. Rao Jammalamadaka, Statistics
George Legrady, Media Arts & Tech
Lisa Parks, Film Studies
|
Next
 |
| |
Abstract
How does information, specifically news stories,
move around the globe from where the news happens to where the public
reads or hears about it? Does it spread like disease, a story ‘infecting’
the population as it is communicated through mass media or from
one person to another, or can it be compared to point-source pollution,
flowing outwards along particular vectors?
The goal of this project is to statistically analyze and visualize
the movement of a news story over time as it is reported in U.S.
newspapers. Traditionally, the idea of information flow pertains
to the evolution of information from its inception to archival where
its geographical path is of little significance. In this project
we aim to consider both the temporal and geographical aspects of
information flow.
Newspaper stories, unlike television, radio or Internet news sources,
have been widely archived in digital databases (such as America’s
Newspapers by Newsbank, Inc.) and are published and circulated in
specific geographical locations By analyzing the statistical and
geographical features of news stories from origin to archival and
the dissemination of the papers to a readership it is hoped that
a mathematical model may be created which helps to explain the spatial
properties of communication channels in the US. Geovisualization
theory and techniques provide the foundation for data exploration
and communication through dynamic maps and graphics.
Stories are selected through a database query on a particular topic
and parsed into a table with headline, newspaper, date, publication
location, and word count. A geographic information system (GIS)
translates the table into a series of maps at different time steps,
indicating the publication of stories at a city level, and Flash
software animates the map sequence to convey the temporal characteristics
of the news stories. For the story content, latent semantic indexing
(LSI) measures story similarity, identifying how relevant a story
is to the main topic and tracking how a news topic evolves over
time. Newspaper circulation and readership information provide statistics
for modeling the spread of the news through the population.
While this research will start on a small scale of comparing the
spread of individual news topics within specific regions, the ultimate
goal is to be able to quickly analyze and visualize any dataset
of news stories, from the scale of a city or urban area, to the
nation as a whole, and potentially worldwide. In addition, there
are several broader implications of this project. Contributing to
a better understanding of the flow of information through a model
will help to identify both strong and weak channels of information
transfer. Such knowledge would be useful in preparing against attacks
on communication systems within a region. Also, emergency response
systems need to know which communication channels reach the most
people in the shortest amount of time. Lastly, it is hoped that
this project could lead to a determination of what effect, if any,
the flow of information has on cross-cultural understanding and
geopolitical (i.e. power) relationships.
|
|
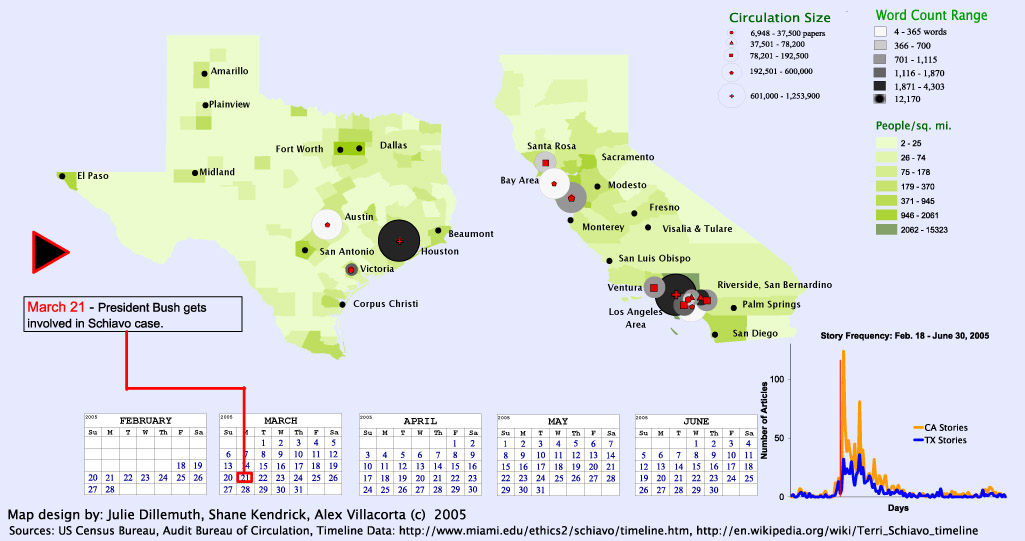
a) March 21, 2005
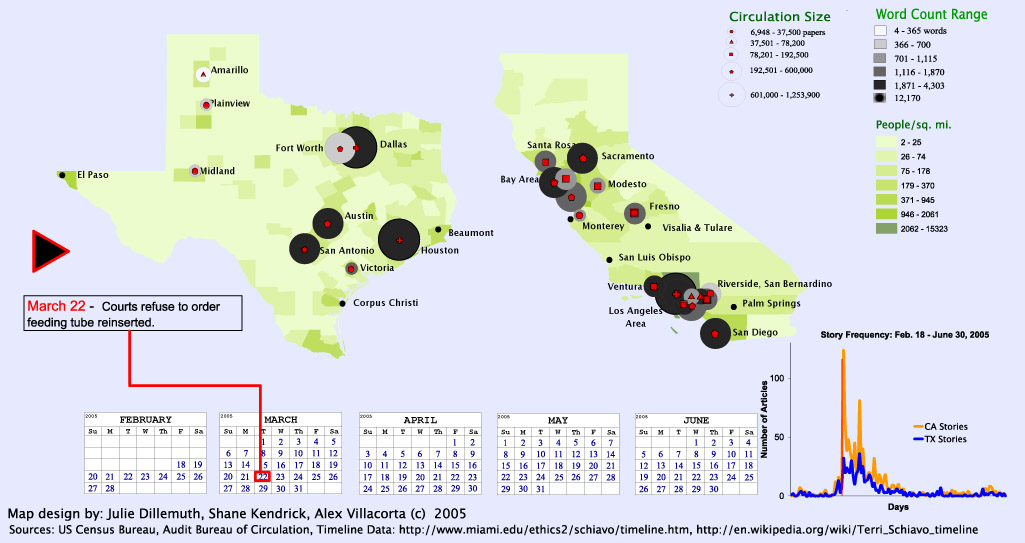
b) March 22, 2005
The above images visualize the spread of news
related to Terry Schiavo from March 21-March 22, 2005. Click an
image for a full picture. |
|
|
|