Interactive Digital Multimedia
IGERT Summer Projects
| Spheres of Influence — Year 3 |
|||||||||
Students
Karl Grossner, Geography Jonathan Ventura, Computer Science Joriz DeGuzman, Computer Science
|
Faculty Advisors
George Legrady, Media Arts & Tech Michael Goodchild, Geography Tobias Hollerer, Comp Science Rich Mayer, Psychology Alex Villacorta, Postdoc
|
||||||||
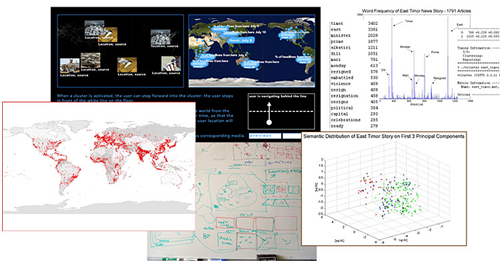
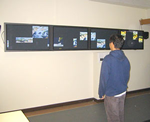
Abstract Spheres of Influence is an ongoing interactive information visualization and digital art project at the University of California, Santa Barbara, now entering its third year. The principal exhibit space is approximately 15ft long, 7ft deep and 10ft high. It includes a wall-mounted display of four horizontally tiled large plasma screens, and an overhead motion-tracking camera system. Users navigate through the visual and textual material displayed on the screens by means of their own movements in front of them. The application now presents the location of the twelve most active current stories on a set of maps, and allows users to select each in turn by “stepping into the story,” to view the global extent and volume of coverage on it, as well as representative headlines, photographs and its most frequently occurring words. The research challenges met include: designing a data model that provides high-performance responses to queries on complex spatio-temporal entities, i.e. news stories; the automated aggregating of related reports into news stories, based on text features; providing an efficient interaction design that offers a high degree of usability; analysis of the cognitive and usability factors governing and constraining interactivity in installation spaces of this kind. The news data captured in the ongoing operation of the installation (4 million reports at this writing) is maintained as a valuable source on which data mining, statistical analysis and geographic information system (GIS) mapping methods may be applied to discover interesting patterns in global news flow. A new version of Spheres of Influence will offer novel visualizations of information from numerous textual and visual data streams concerning the 18-month 2008 US presidential election.
|
|
||||||||